
Invest in your future
A simple investment ISA solution to help you potentially grow your savings
Why invest your money with us?
Please remember
The value of your investment will go up and down. It isn’t guaranteed, so you may get back less than you put in.
Whilst an ISA is usually considered as a medium to long-term investment for at least five years, there is no fixed term for your investment.
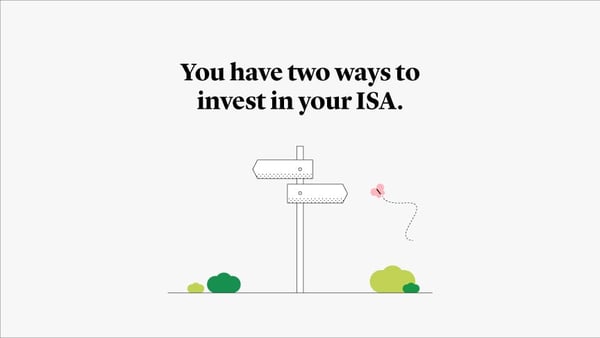
Stocks and Shares ISA
Start saving from just £20 a month, or a £100 lump sum deposit.
Investing in stocks and shares made simple
Helpful links

ISAs Explained
New to investing? Learn all about what ISAs are, how they work and the different types of ISA available to you.

Understanding risk
Investing money always comes with a degree of risk. Learn more about how to choose the best risk level for you.

Want to get in touch?
Find all the ways you can get in touch with us about your Investment product.